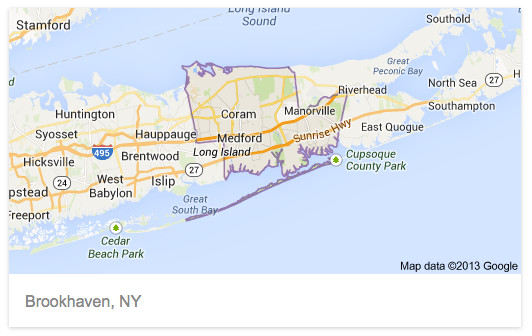
Let’s look at the important numbers in NY CD-1.
Demographics:
Table I (Source: Ballotpedia, based on 2010 census)
| Population | 720,071 |
| Gender | 49.6% Male, 50.4% Female |
| Race | 87.7% White, 4.6% Black, 3.5% Asian |
| Ethnicity | 12.8% Hispanic |
| Unemployment | 6.60% |
| Median household income | $83,144 |
Nearly 20% are minorities (Black, Asian, or Hispanic). Some Hispanics will call themselves “racially” white, but claim hispanic ethnicity.
Lesson: Don’t count on a huge minority vote because of disgust in Trump’s racial bigotry and Zeldin’s backing of Trump.
Party Affiliation:
Source: https://www.elections.ny.gov/NYSBOE/enrollment/congress/congress_nov12.pdf
Table II
| raw numbers | percentages | |
| Dems | 143,917 | 30.4 |
| Reps | 162,212 | 34.3 |
| Cons | 11,806 | 2.5 |
| Ind | 23,215 | 4.9 |
| Blank | 125,516 | 26.6 |
| Other | 5,985 | 1.3 |
| Total | 472,651 | 100 |
Assuming equal voter turn out for each party, and assuming that ‘Independants’, ‘Blanks’ and ‘Other’ break out 50/50 for the Dem versus Rep candidate, Dems can not win.
Assuming all Dems vote Dem and all Reps vote Rep, we still need about 30,000 votes from the Ind, Blanks, Other. And perhaps those 30,000 votes could include some from the Rep/Cons group.
Lesson: This has long been the main point of Tim Bishop whenever he speaks: Dems cannot win in CD-1 with out help from those registered in the red, purple or blank parties.
Voter Turnout
Many are quick to claim that we can win with a high Dem turn out. The so called blue wave expected for 2018. But let’s look seriously at the data. It is the data from prior elections. Ofcourse you can claim that in the Trump era nothing from the past applies. But this is all we have got. So lets look at it.
Table III (Source: Ballotpedia )
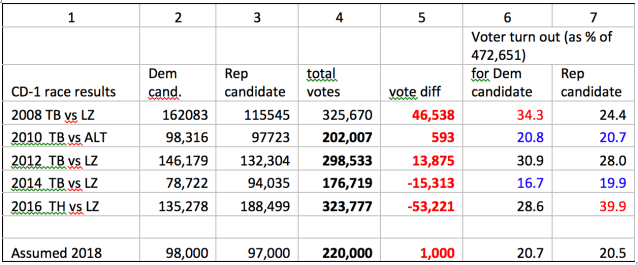
Column 1 lists the races going back to 2008.
Column 2 tallies the vote numbers for the Dem candidate
Column 3 tallies the vote numbers for the Rep candidate
Column 4 tallies the total votes cast (some voters did not vote for either R or D candidate): notice the much lower numbers for midterm elections in 2010 and 2014.
Column 5 lists the difference between the total votes for D and R candidates: notice the trend from positive numbers (Dem majority) to negative numbers (Rep majority). Our district is becoming more and more red.
Column 6 is the vote percentage of total registered voters that went to the Dem candidate*
Column 7 is the vote percentage of total registered voters that went to the Rep candidate*
* these numbers are calculated as the votes obtained by the Dem (or Rep) candidate per total number of registered voters. 472,651 is the current number of registered voters. This does not equal the turnout within the Dem party or within the Rep party, because f.ex. an undetermined number of U (unaffiliated) would also have voted for either D or R candidate.
Note also the low numbers for the Dems in 2010 and 2014, suggesting that Dem voters did not vote (low turnout) in those years.
I have made some assumptions, see ‘Assumed 2018’, in Table III:
- Dem vote numbers and Rep vote numbers might be similar to 2010
- Dem turnout conservatively estimated to be similar to 2010 (historically this is a high turnout for a midterm election) – however if a country wide blue wave materializes the turn out could be even better
- I assumed a similar turnout of Rep voters to prior midterm elections, for example 2010. BUT this would mean that roughly half of the voters that voted for Trump/Zeldin in 2016 fail to turn out and vote in 2018. That is probably wishful thinking. National polls suggest that Trumps base is holding stead fast with 35-40% of Americans approving Trump’s performance. I would expect that to be true in CD-1 too. See also Marc Rauch’s comment below.
- It is clear from these data that LZ needs his Rep. base to turn out in 2018 and this explains his current turn to the far right, his support for Trumps immigration hawks, like Chief of Staff Kelly, and Stephen Miller in the White house, and his position attacking the FBI along with Devon Nunez etc.
- Here is another scenario proposed by Marc Rauch: The 2017 off-off-year elections saw a huge turnout (to some extent attributable to the Con/Con) just for a local election in an odd-numbered year. Democrats in Brookhaven Township rolled up impressive numbers (compared to 2015), but Republicans in Brookhaven Township rolled up even more impressive numbers (compared to 2015) and beat them solidly. This shows the Republican machine in Brookhaven Township is alive and well and this is where 63% of CD-1 voters are. So, 2018 may not be a sleepy off-year Congressional election. Republicans will fight tooth and nail and spend huge sums of money (remember why that tax bill had to pass) to keep control of both houses of Congress. Dems hopefully will fight just as hard or harder to grab the House or Senate and hopefully will be reasonably well-funded. An enormous amount of attention will be focused on the November elections nationally, and it will be more like a presidential election year than an off year in terms of turnout. The bottom line is, assume high turnout for both Dems and Reps. The fight will be over who can get most of those in the middle to break their way. If this scenario proves correct, we will need 30,000 crossover votes as described above (see Table II).
Bottom line: this will not be a cakewalk.